There are no items in your cart
Add More
Add More
| Item Details | Price | ||
|---|---|---|---|
End-to-End DevOps CI/CD Pipeline Workflow
A Complete Production Blueprint: Infrastructure Provisioning, Containerization, GitOps, Kubernetes Resources, Full-Stack Observability & Incident Alerting
A true enterprise-grade DevOps architecture extends beyond building and deploying code. It spans the entire lifecycle: Source Code Management ➔ CI/CD Automation ➔ Quality Gates ➔ Container Registries ➔ Infrastructure as Code ➔ Managed Kubernetes ➔ GitOps Deployment ➔ Resource Routing ➔ Full-Stack Observability ➔ Incident Alerting.
Below is the complete 13-stage workflow diagram governing modern production platforms:
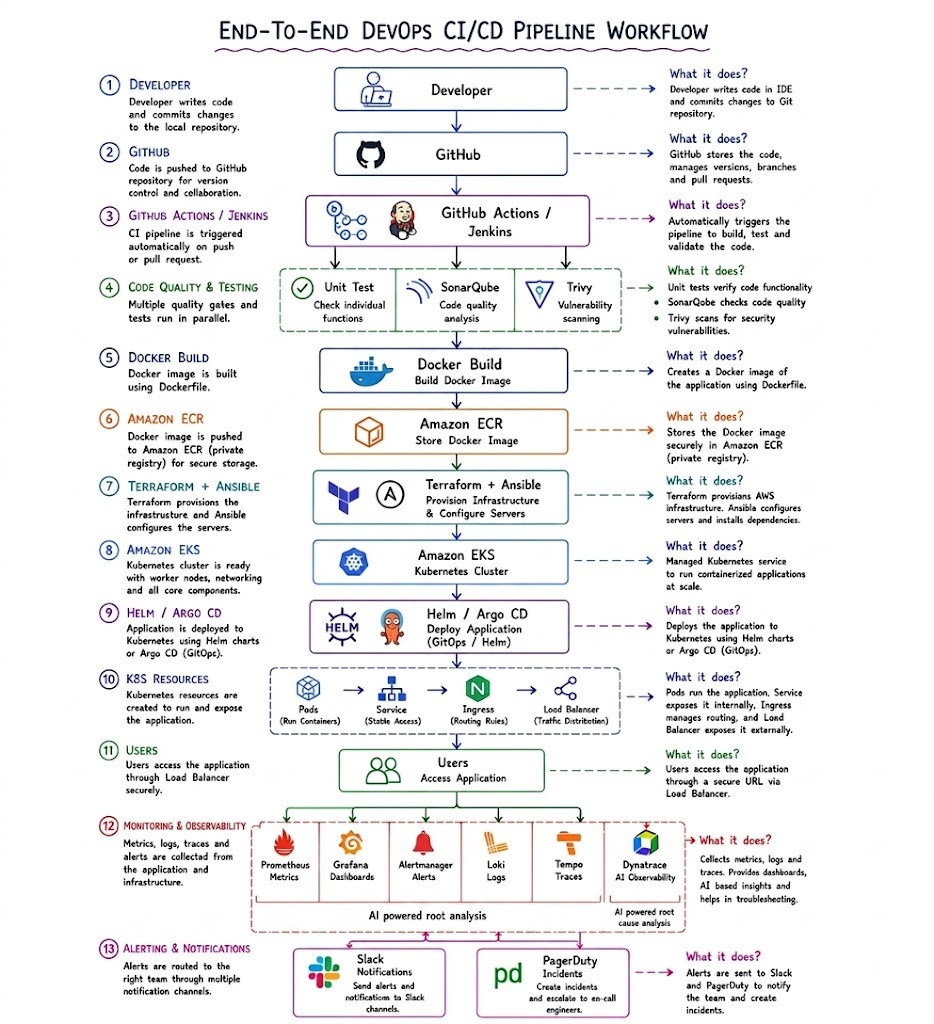
Below is a comprehensive, step-by-step technical breakdown of all 13 stages in this enterprise DevOps & DevSecOps workflow—explaining the exact tools, CLI commands, configuration files, and architecture flows that power each component in production.
What it does: The developer writes application features, bug fixes, and unit tests in their local IDE (VS Code, IntelliJ, PyCharm) on a local feature branch (e.g. feature/user-profile). Before committing, local Git pre-commit hooks (using Husky or Gitleaks) automatically run code linters and scan the local workspace to prevent hardcoded passwords, API tokens, or AWS credentials from ever reaching Git history.
Tools Used: VS Code, Git, Husky, Gitleaks, ESLint/Prettier.
# Create feature branch, stage changes, and commit
git checkout -b feature/user-profile
git add .
git commit -m "feat(user): implement user profile endpoint with unit tests"What it does: Code is pushed to the central GitHub repository. GitHub acts as the version control hub, managing source code history, branch protection rules (requiring 2 code reviews and passing CI checks), Pull Request (PR) discussions, and dispatching automated Webhook trigger payloads to the CI pipeline server upon push events.
Tools Used: GitHub, Pull Requests, Branch Protection Rules.
git push origin feature/user-profileWhat it does: Catches the incoming push/PR webhook and triggers the Continuous Integration (CI) pipeline job. The runner environment (ephemeral GitHub-hosted runner or Jenkins Kubernetes pod agent) provisions a clean container, checks out the code, and initiates the automated build matrix.
Tools Used: GitHub Actions workflows (.github/workflows/ci.yml) or Jenkins Declarative Pipelines (Jenkinsfile).
name: CI Build Pipeline
on:
  push:
    branches: [ main ]
  pull_request:
    branches: [ main ]

jobs:
  build-and-test:
    runs-on: ubuntu-latest
    steps:
    - uses: actions/checkout@v4
    - name: Set up JDK
      uses: actions/setup-java@v3
      with:
        java-version: '17'
distribution: 'temurin'What it does: Runs multiple automated quality gates and security scans in parallel to enforce strict software quality standards:
# Run Unit Tests & SonarQube Scanner
mvn test sonar:sonar -Dsonar.projectKey=my-app

# Run Trivy Filesystem Vulnerability Scan
trivy fs --security-checks vuln,config --severity HIGH,CRITICAL .What it does: Creates an immutable Docker container image of the application using multi-stage Dockerfile builds (which separate build-time dependencies from slim runtime images). The image is tagged with the exact Git commit SHA (e.g. my-app:v1.2.0-8f9e0a1) to guarantee 100% build reproducibility across environments.
# Multi-stage Dockerfile
FROM maven:3.9-eclipse-temurin-17 AS builder
WORKDIR /app
COPY . .
RUN mvn clean package -DskipTests

FROM eclipse-temurin:17-jre-alpine
WORKDIR /app
COPY --from=builder /app/target/app.jar app.jar
EXPOSE 8080
ENTRYPOINT ["java", "-jar", "app.jar"]

# Build command
docker build -t 123456789012.dkr.ecr.us-east-1.amazonaws.com/my-app:${GIT_SHA} .What it does: Stores the built Docker container image securely in Amazon Elastic Container Registry (ECR). ECR enables AES-256 encryption at rest, IAM role-based repository access policies, and automated Scan on Push to discover newly disclosed CVE vulnerabilities continuously.
aws ecr get-login-password --region us-east-1 | docker login --username AWS --password-stdin 123456789012.dkr.ecr.us-east-1.amazonaws.com
docker push 123456789012.dkr.ecr.us-east-1.amazonaws.com/my-app:${GIT_SHA}What it does: Declarative Infrastructure as Code (IaC) & Automated Configuration Management:
# Provision Infrastructure with Terraform
terraform init
terraform plan -out=tfplan
terraform apply tfplan

# Configure Servers with Ansible
ansible-playbook -i inventory/hosts.yaml playbooks/setup-node.yamlWhat it does: Managed Kubernetes service in AWS running production worker node groups (EC2 / Fargate), networking via AWS VPC CNI (giving pods native VPC IP addresses), IAM Roles for Service Accounts (IRSA), CoreDNS, and Kube-Proxy ready to host containerized microservices at scale.
What it does: Packaging and GitOps Continuous Delivery:
values.yaml parameters.What it does: Creates Kubernetes objects to run and expose the containerized application securely:
[Pods] ➔ Running application containers
  │
  ▼
[Service (ClusterIP)] ➔ Provides stable internal IP & DNS name
  │
  ▼
[Ingress (NGINX Controller)] ➔ Path routing (/api) & SSL Termination
  │
  ▼
[AWS Application Load Balancer] ➔ Exposes app externally to public internetWhat it does: Global end-users access the live application via HTTPS (Port 443) over TLS 1.3 encryption. Route 53 resolves the domain name, AWS WAF filters malicious web attacks, and the ALB distributes traffic to healthy Kubernetes pods across multiple Availability Zones.
What it does: Collects real-time metrics, log streams, distributed request traces, and AI insights across infrastructure and applications:
Scrapes time-series metrics (CPU, RAM, network IO, HTTP request counts) from Kubernetes nodes, pods, and application /metrics endpoints.
Visualizes time-series metrics with rich, interactive real-time dashboards and threshold alert annotations.
Receives alert triggers from Prometheus, deduplicates alert groups, and dispatches notifications to on-call receivers.
Aggregates and indexes container log streams (stdout/stderr) efficiently without full-text index overhead.
Collects distributed request traces (W3C Trace Context headers) to visualize exact latency across microservices.
Full-stack AI-driven observability engine delivering automated anomaly detection and root cause analysis.
What it does: Routes operational alerts to engineering teams via multi-channel notification policies:
| Phase | Core Tools | Primary Objective |
|---|---|---|
| Version Control | GitHub / Git | Manage code branches, pull requests, and commit history |
| CI Orchestration | Jenkins / GitHub Actions | Automate build, unit testing, and validation pipelines |
| Code Quality & Security | SonarQube, Trivy, OWASP | Shift security left and enforce Quality Gates before building |
| Container Registry | Docker, Amazon ECR | Create and securely store immutable container images |
| Infrastructure as Code | Terraform, Ansible | Provision AWS cloud resources and configure servers declaratively |
| Orchestration & GitOps | Amazon EKS, Helm, Argo CD | Deploy and sync application state to Kubernetes automatically |
| Observability & Alerts | Prometheus, Grafana, Loki, Slack, PagerDuty | Monitor full-stack health and alert on-call teams proactively |
Answer: Terraform is used for Infrastructure Provisioning (creating VPCs, subnets, EKS clusters, S3 buckets). Ansible is used for Configuration Management (configuring operating systems, installing packages, updating server settings post-provisioning).
Answer: Prometheus handles numeric Metrics (CPU, RAM usage), Loki handles Logs (container console outputs), and Tempo handles distributed Traces (request duration across microservices). Grafana unifies all three into a single dashboard.
Answer: Argo CD runs inside Kubernetes and constantly compares the live cluster state against the desired state defined in Git. If someone manually changes a pod or service using kubectl, Argo CD flags the "Out of Sync" drift and auto-reconciles back to Git.
Answer: Non-critical warnings (e.g. build completion, minor warning alerts) are routed to Slack for team awareness. Critical outages (e.g. EKS pod crashes, high latency) trigger PagerDuty to wake up on-call engineers via phone/SMS.