There are no items in your cart
Add More
Add More
| Item Details | Price | ||
|---|---|---|---|

A Visual Guide to Troubleshooting Kubernetes Deployments
Master Kubernetes troubleshooting. Debug pod failures, resolve common errors, and diagnose deployment issues with step-by-step strategies.
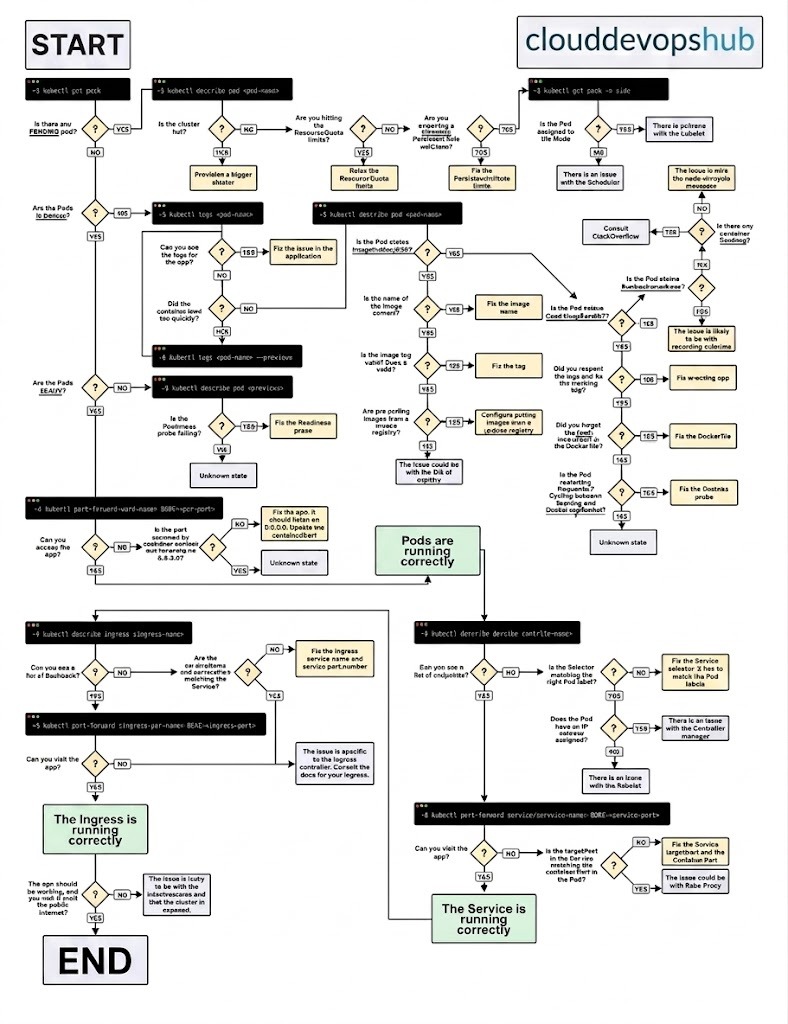
Troubleshooting in Kubernetes can be a daunting task. Here is a comprehensive diagram to help you visually debug your deployments in Kubernetes.
When you wish to deploy an application in Kubernetes, you usually define three core components:
Here is a quick visual recap of how these three layers interact:
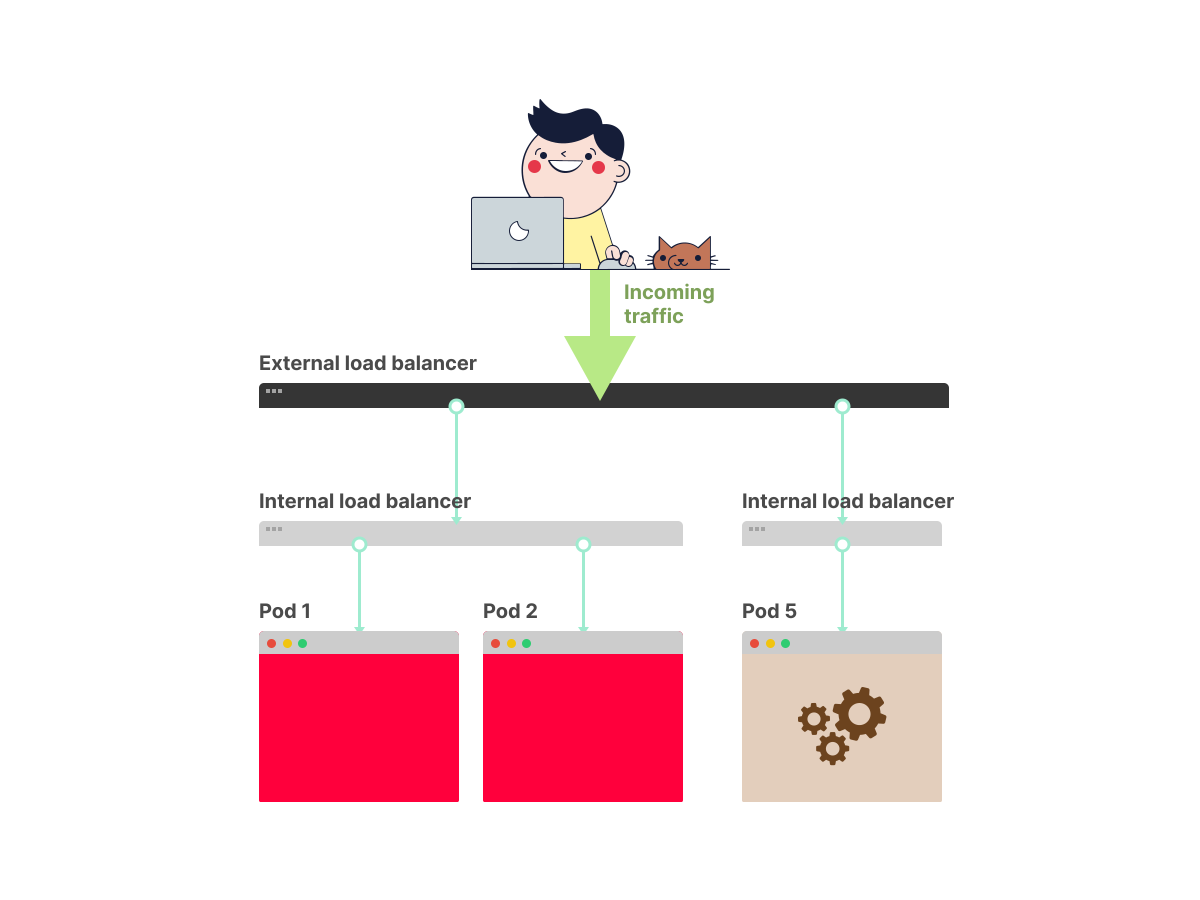
1. Dual Load Balancer Layers: Applications are exposed via internal and external load balancers.
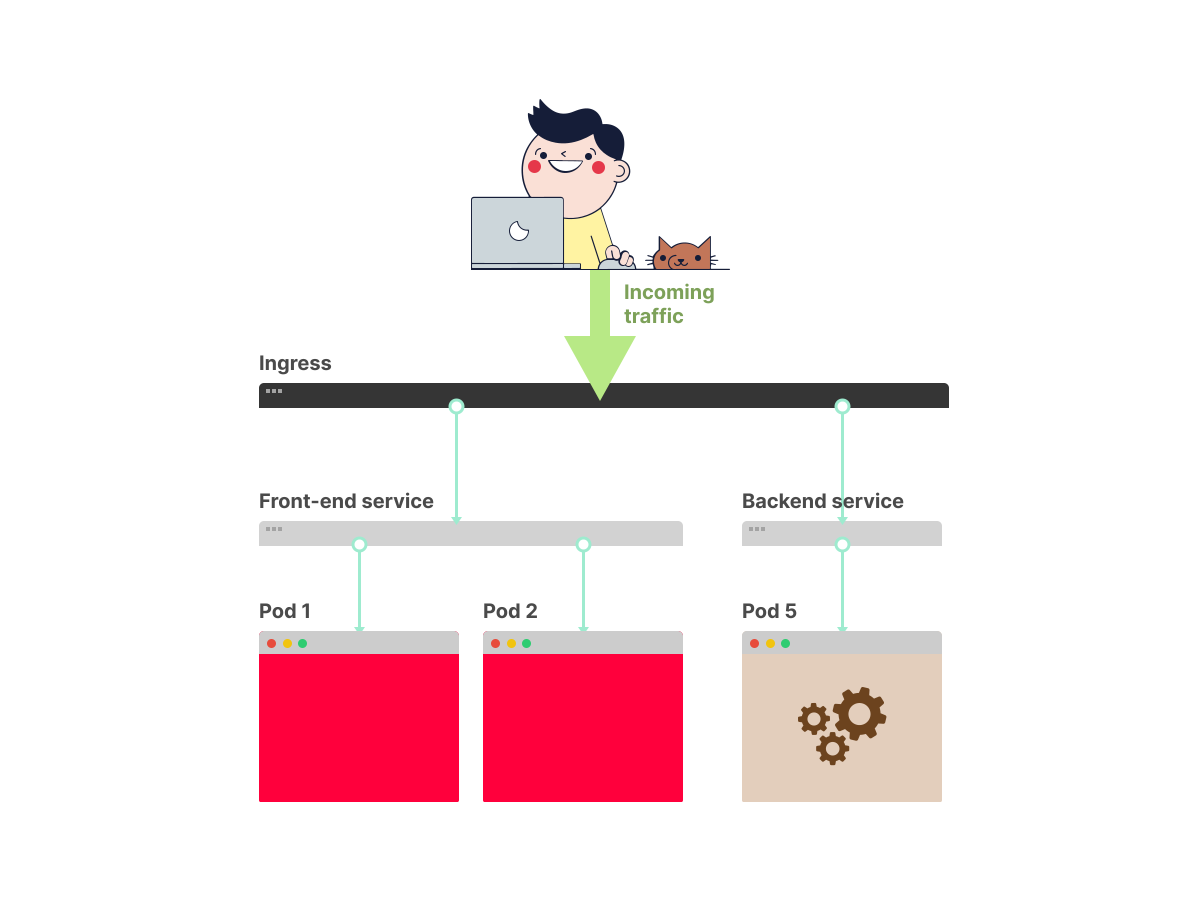
2. Service & Ingress: The internal load balancer is the Service; the external entry point is the Ingress.
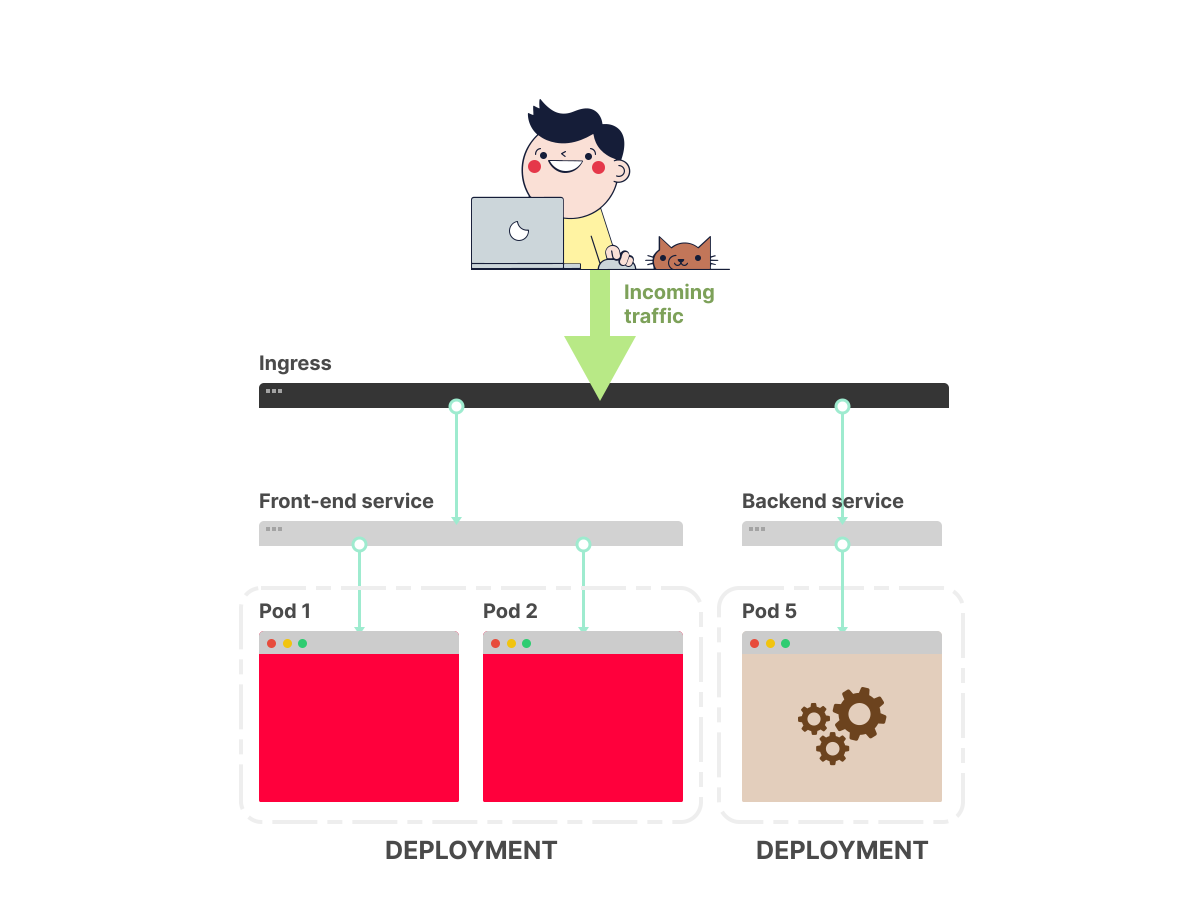
3. Deployment Controller: Pods are not managed directly. Deployments spin up Pods and maintain replica count.
Assuming you wish to deploy a simple Hello World application, the YAML manifest for such an application looks like this:
apiVersion: apps/v1
kind: Deployment
metadata:
  name: my-deployment
  labels:
    track: canary
spec:
  selector:
    matchLabels:
      any-name: my-app
  template:
    metadata:
      labels:
        any-name: my-app
    spec:
      containers:
        - name: cont1
          image: ghcr.io/learnk8s/app:1.0.0
          ports:
            - containerPort: 8080
---
apiVersion: v1
kind: Service
metadata:
  name: my-service
spec:
  ports:
    - port: 80
      targetPort: 8080
  selector:
    name: app
---
apiVersion: networking.k8s.io/v1
kind: Ingress
metadata:
  name: my-ingress
spec:
  rules:
  - http:
      paths:
      - backend:
          service:
            name: my-service
            port:
              number: 80
        path: /
        pathType: Prefix
This definition is quite lengthy, and it is easy to overlook how the components relate to one another. Common questions arise instantly:
Before jumping into troubleshooting steps, let's establish how these three components link together.
Service and Deployment are NOT directly connected! Instead, the Service selector bypasses the Deployment and points directly to the underlying Pods based on labels.
To successfully link a Service to your Pods, pay close attention to three fundamental rules:
selector must match at least one label defined in the Pod template.targetPort must match the containerPort exposed inside the container.port can be any integer. Multiple Services can share port 80 because each Service gets a unique Cluster IP address assigned.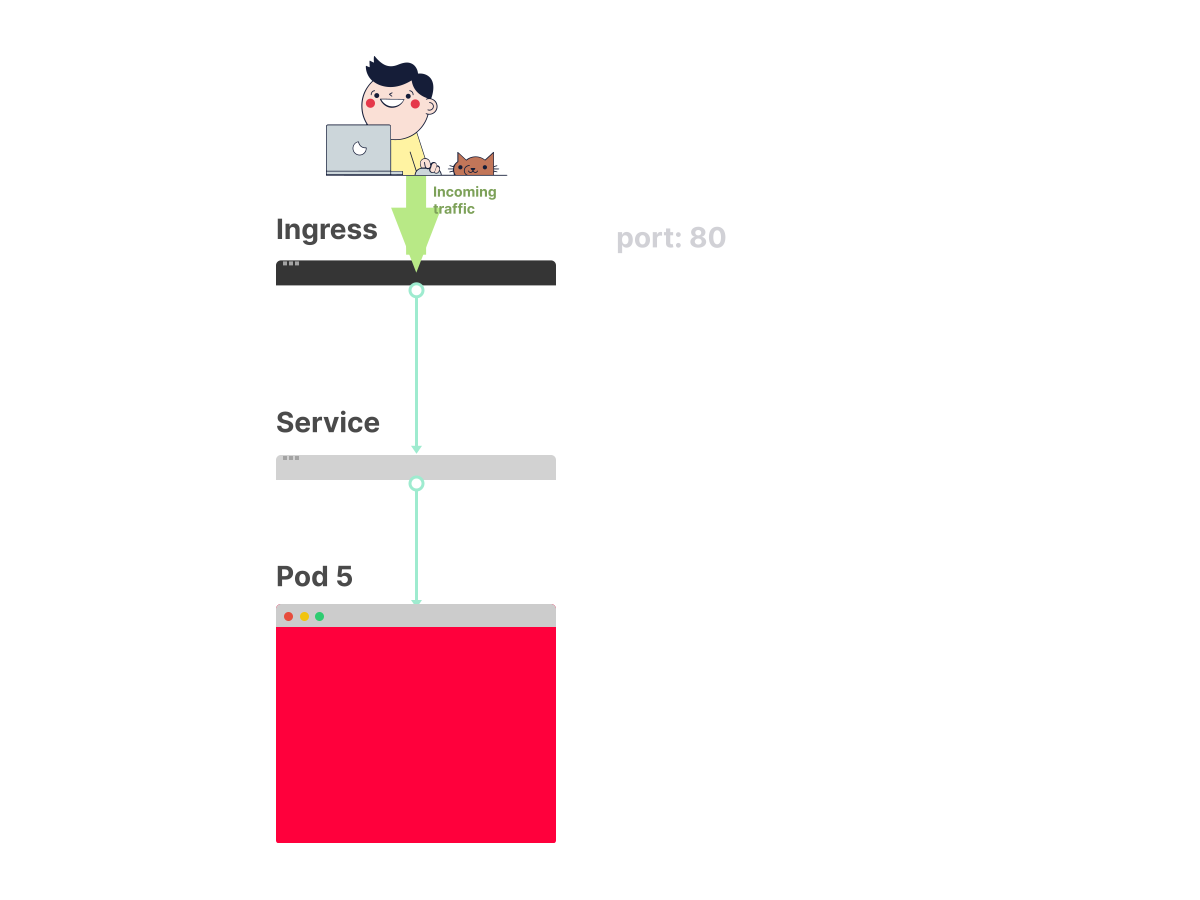
1. Pod exposed by Service
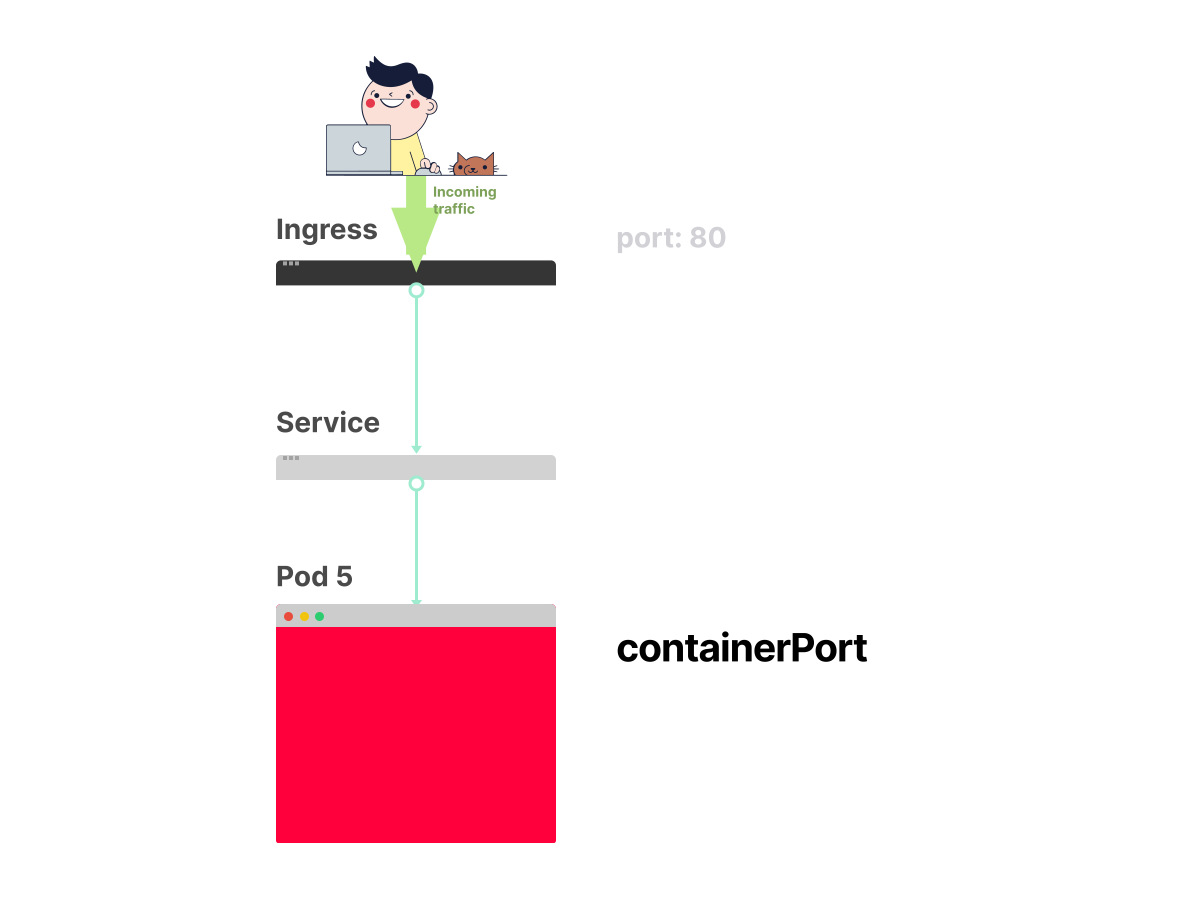
2. Define containerPort
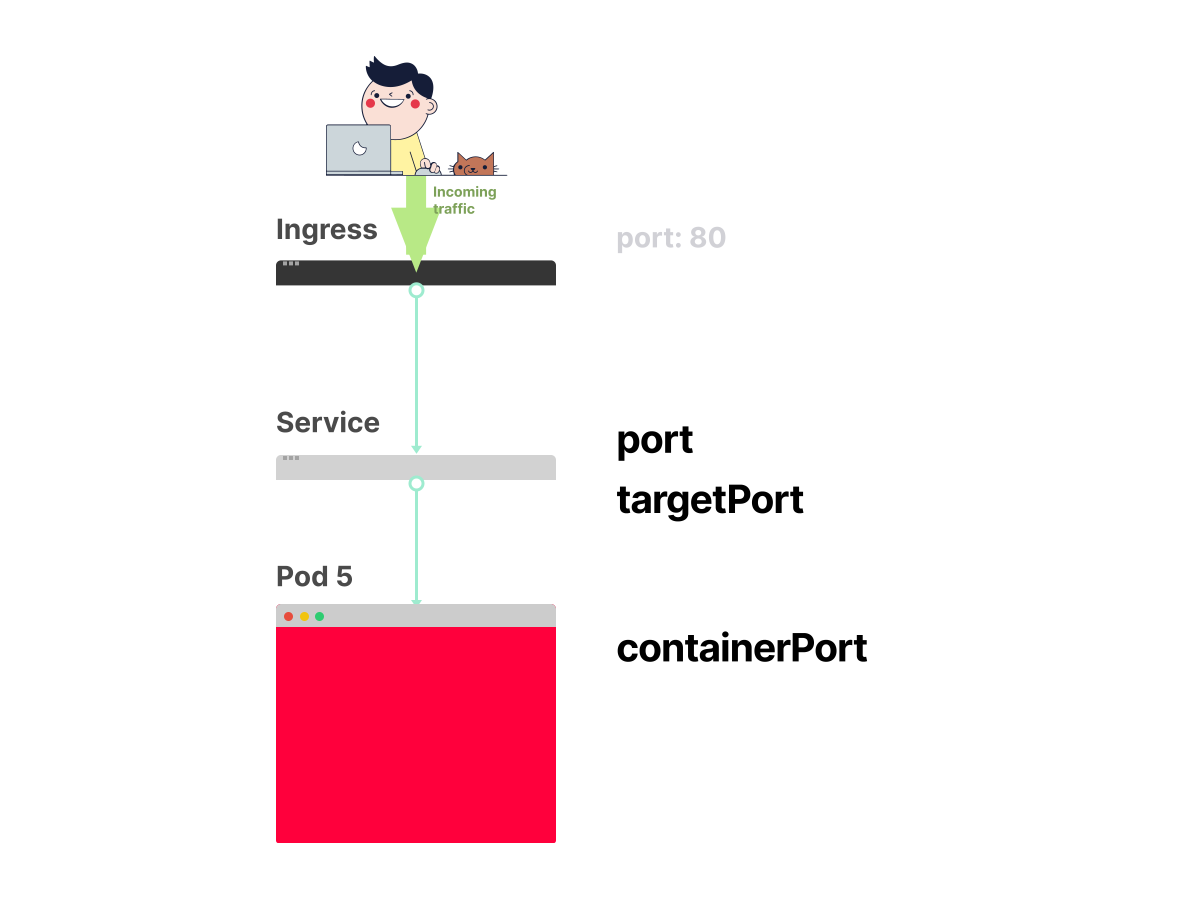
3. Service port vs targetPort
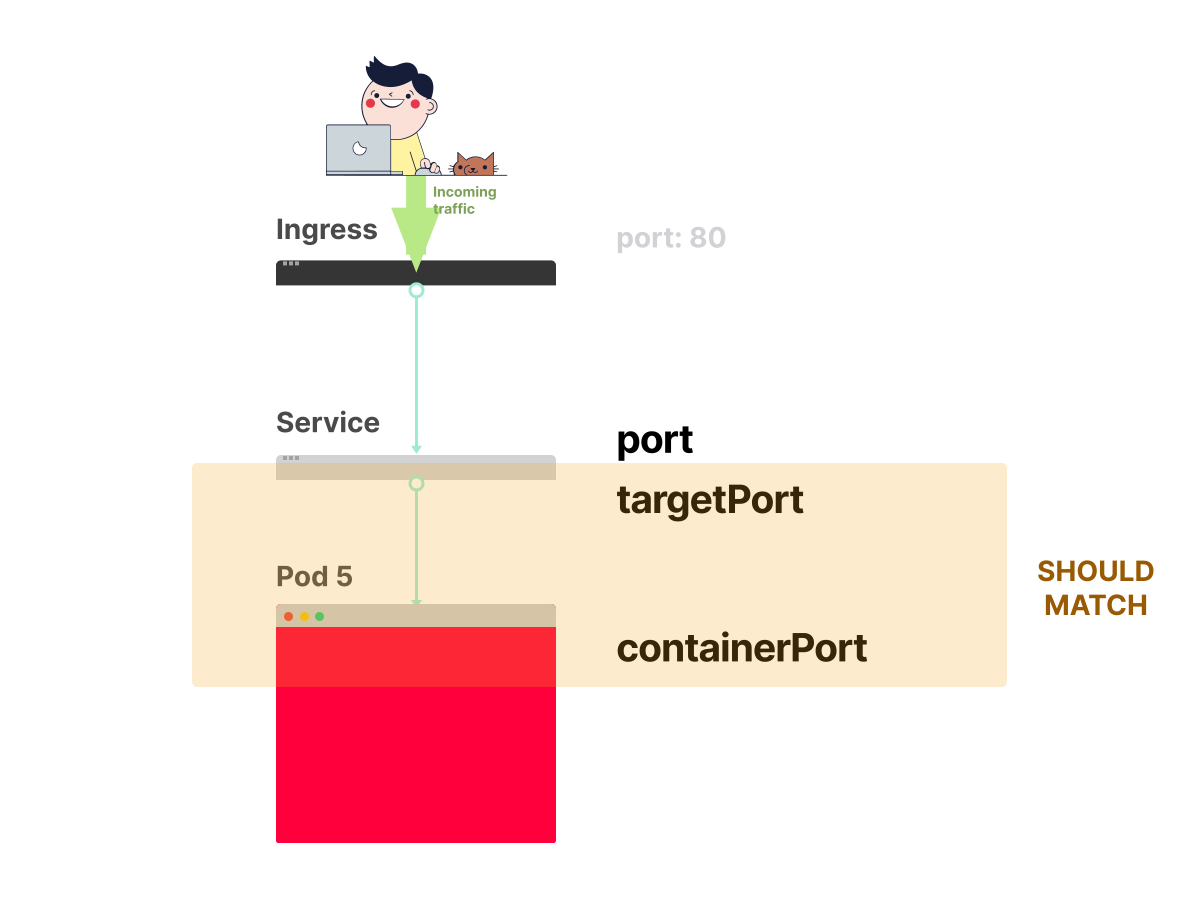
4. targetPort = containerPort
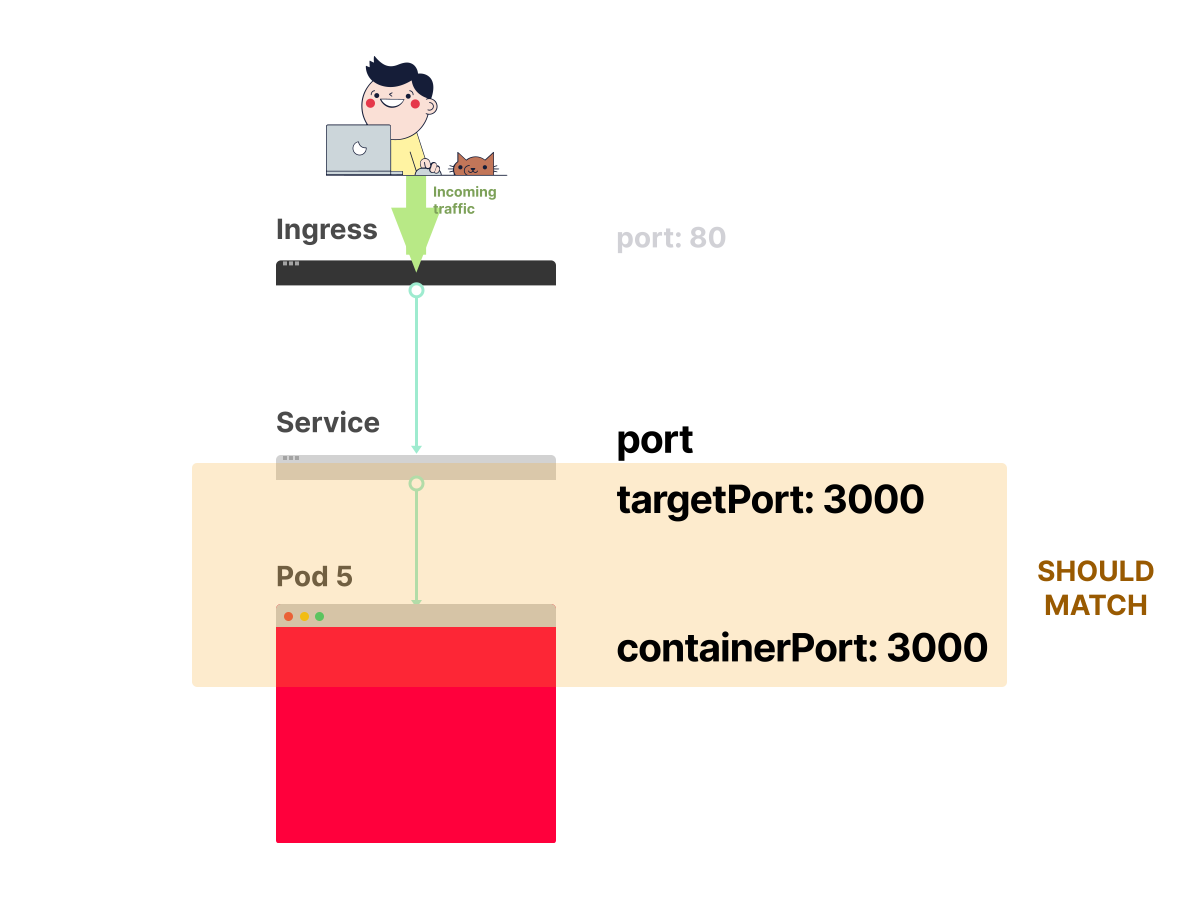
5. Example: Container port 3000
Correcting the labels and ports alignment in our earlier YAML yields:
apiVersion: apps/v1
kind: Deployment
metadata:
  name: my-deployment
  labels:
    track: canary
spec:
  selector:
    matchLabels:
      any-name: my-app
  template:
    metadata:
      labels:
        any-name: my-app
    spec:
      containers:
        - name: cont1
          image: ghcr.io/learnk8s/app:1.0.0
          ports:
            - containerPort: 8080
---
apiVersion: v1
kind: Service
metadata:
  name: my-service
spec:
  ports:
    - port: 80
      targetPort: 8080
  selector:
    any-name: my-app
track: canary? That top-level label belongs solely to the Deployment resource itself. It is not used by the Service selector, so you can safely modify or remove it.matchLabels? The Deployment uses spec.selector.matchLabels to track and manage its owned Pods. It MUST match spec.template.metadata.labels.How to test this connection? Verify that Pods carry the correct labels using kubectl:
kubectl get pods --show-labels
# Output:
# NAME                  READY   STATUS    LABELS
# my-deployment-pv6pd   1/1     Running   any-name=my-app,pod-template-hash=7d6979fb54
# my-deployment-f36rt   1/1     Running   any-name=my-app,pod-template-hash=7d6979fb54

# Filter pods by specific selector label:
kubectl get pods --selector any-name=my-app --show-labels
You can test connectivity to your Service using kubectl port-forward:
kubectl port-forward service/my-service 3000:80
# Forwarding from 127.0.0.1:3000 -> 8080
# Forwarding from [::1]:3000 -> 8080
Where 3000 is your local computer's port, and 80 is the Service port. If you get a valid response at http://localhost:3000, your Service-to-Pod routing is functioning correctly!
The next layer involves exposing your app to external cluster clients by configuring the Ingress resource.
Two essential fields must align between the Ingress and the Service:
service.name must exactly match the Service metadata.name.service.port.number must match the Service spec.ports[].port.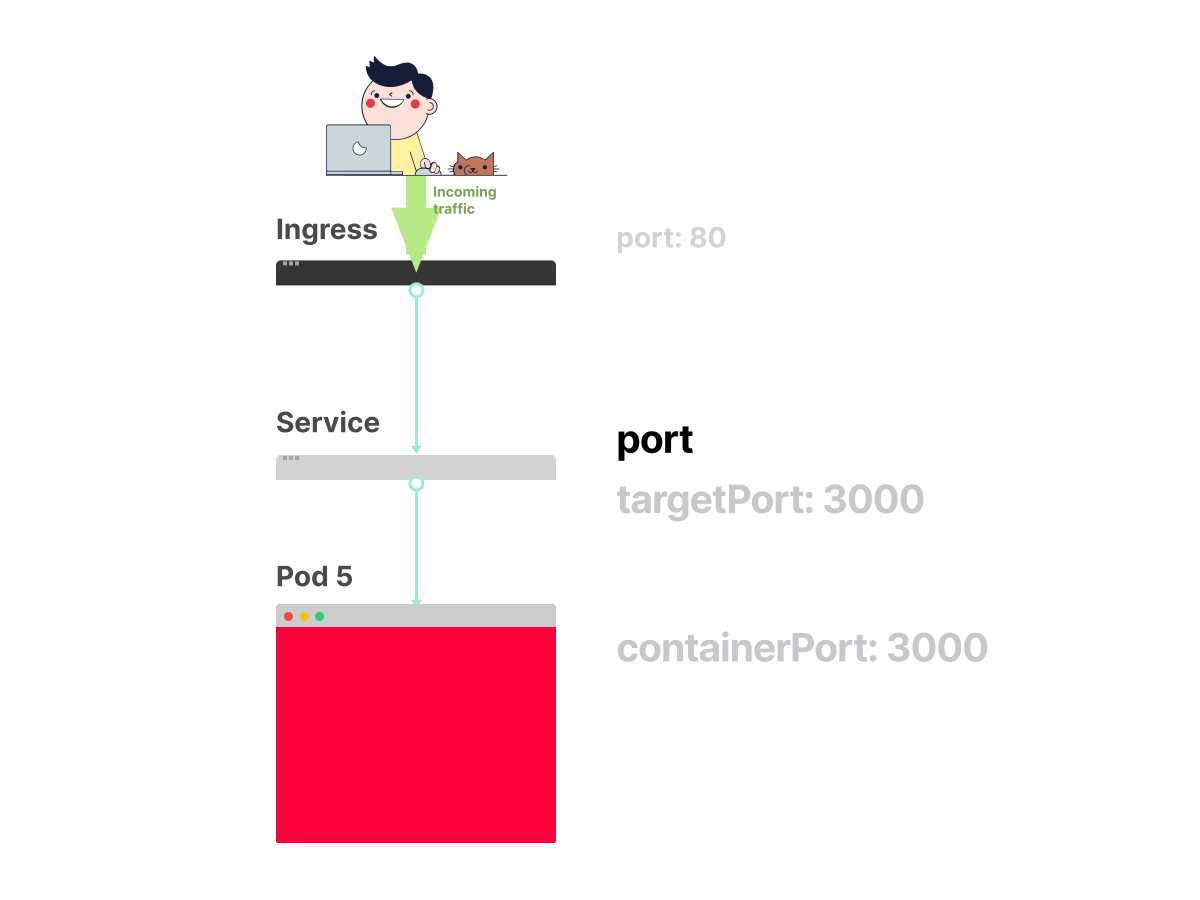
1. Service exposes port
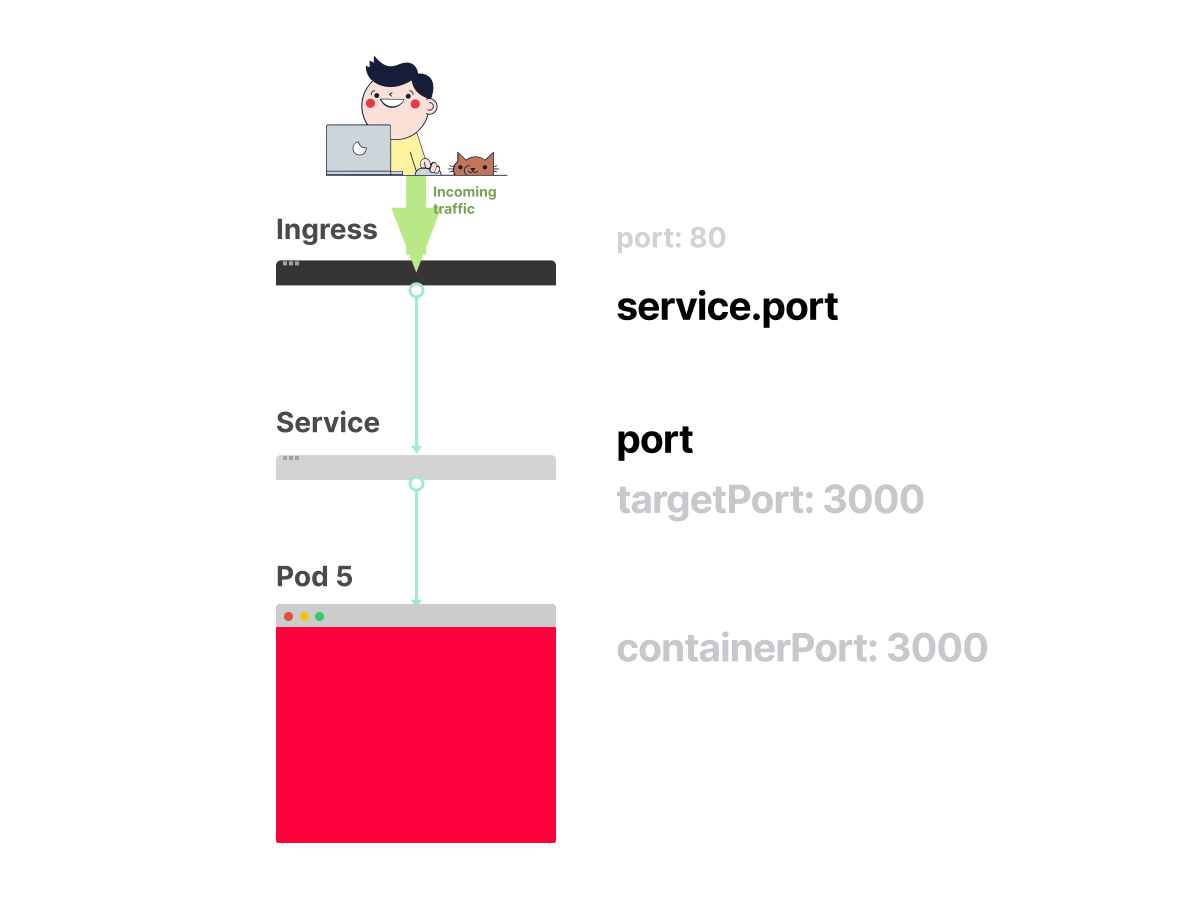
2. Ingress specifies servicePort
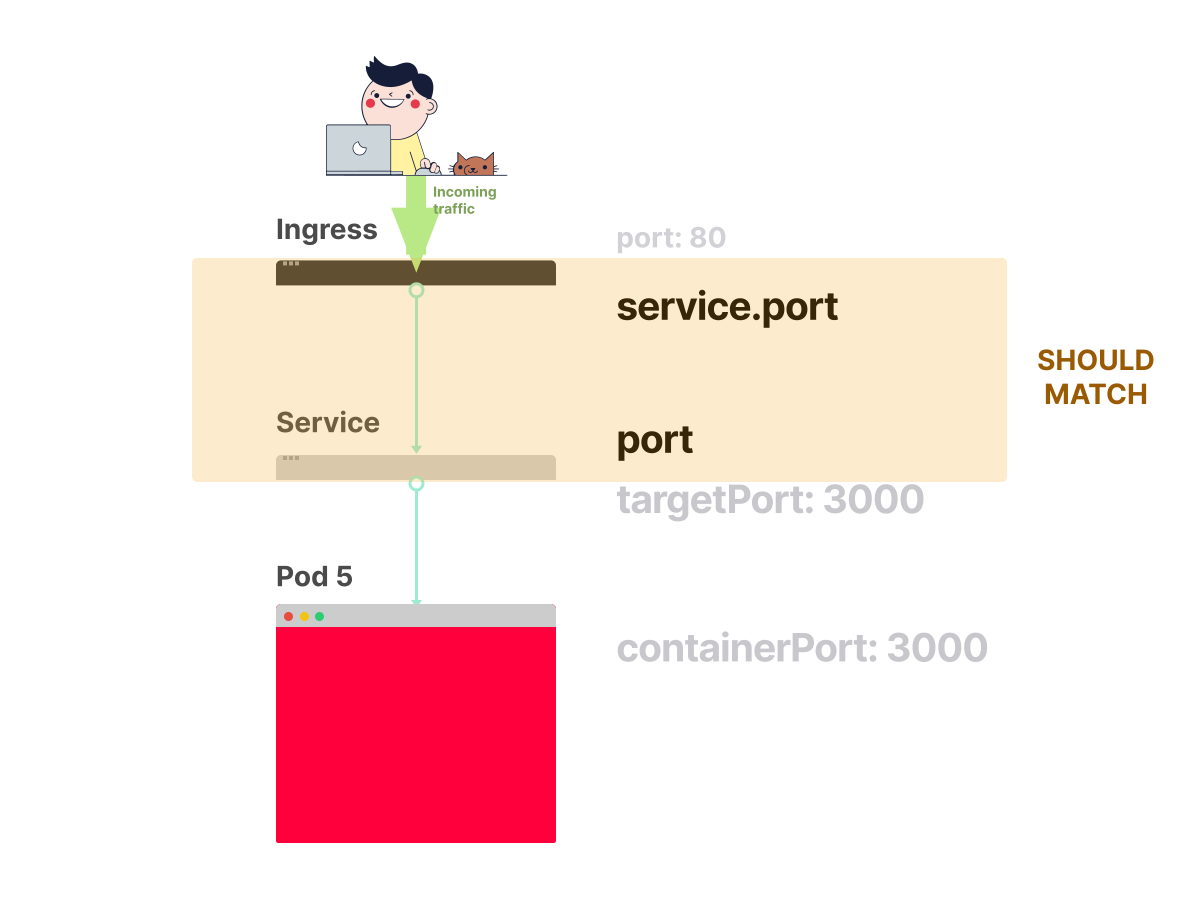
3. Service port & Ingress port match
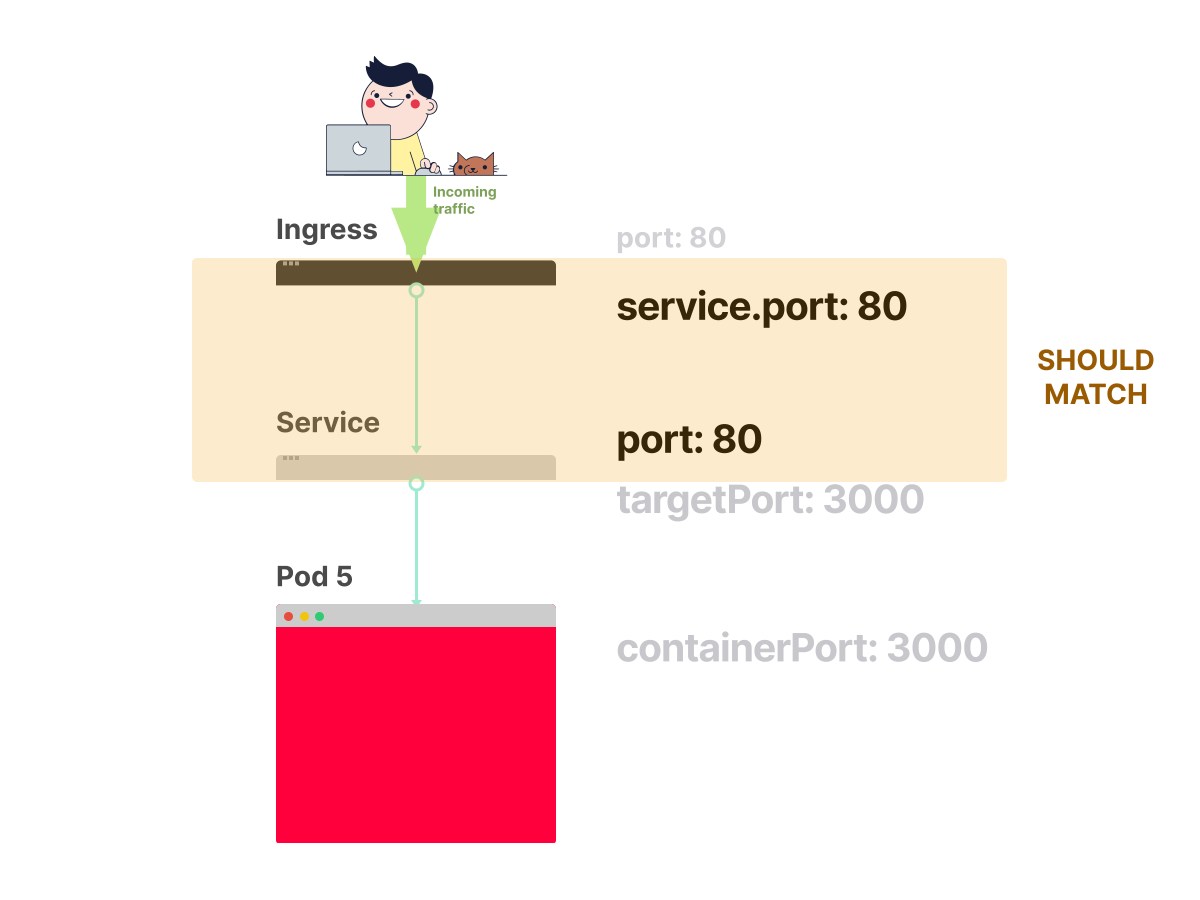
4. Example: Match on port 80
apiVersion: v1
kind: Service
metadata:
  name: my-service
spec:
  ports:
    - port: 80
      targetPort: 8080
  selector:
    any-name: my-app
---
apiVersion: networking.k8s.io/v1
kind: Ingress
metadata:
  name: my-ingress
spec:
  rules:
  - http:
      paths:
      - backend:
          service:
            name: my-service
            port:
              number: 80
        path: /
        pathType: Prefix
Testing Ingress Routing: Forward ports directly to your Ingress Controller Pod:
# 1. Locate Ingress Controller pod
kubectl get pods --all-namespaces

# 2. Inspect exposed ports on the Ingress pod
kubectl describe pod nginx-ingress-controller-6fc5bcc --namespace kube-system | grep Ports
# Output: Ports: 80/TCP, 443/TCP, 18080/TCP

# 3. Port forward to the Ingress controller
kubectl port-forward nginx-ingress-controller-6fc5bcc 3000:80 --namespace kube-system
spec.selector in Service MUST match metadata.labels in Pod template.targetPort in Service MUST match containerPort in Pod spec.port in Service can be any arbitrary number. Multiple Services can reuse port 80.port.metadata.name.Having a structured mental model is essential when dealing with broken deployments. Always debug starting from the bottom of the stack upwards:
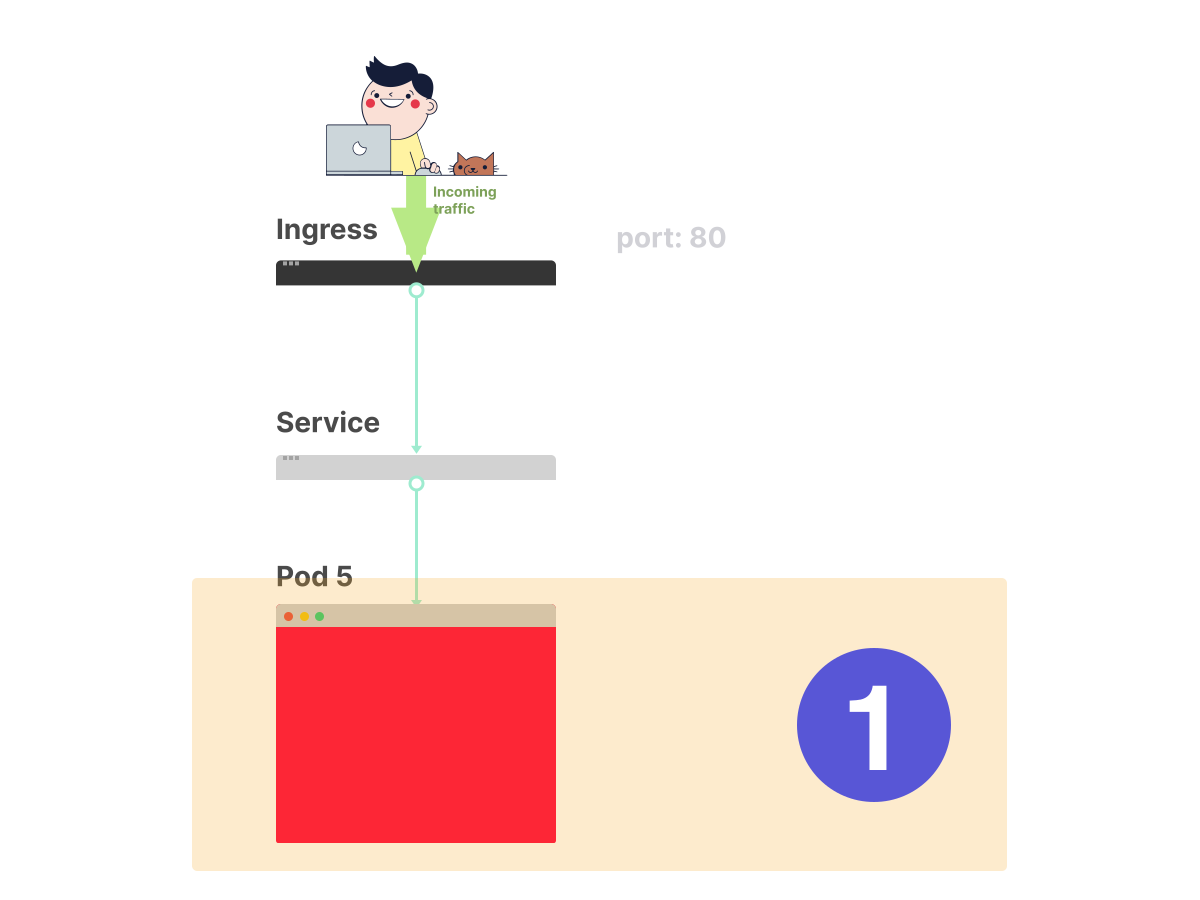
Step 1: Debug Pods
Verify that Pods are in Running and Ready status.
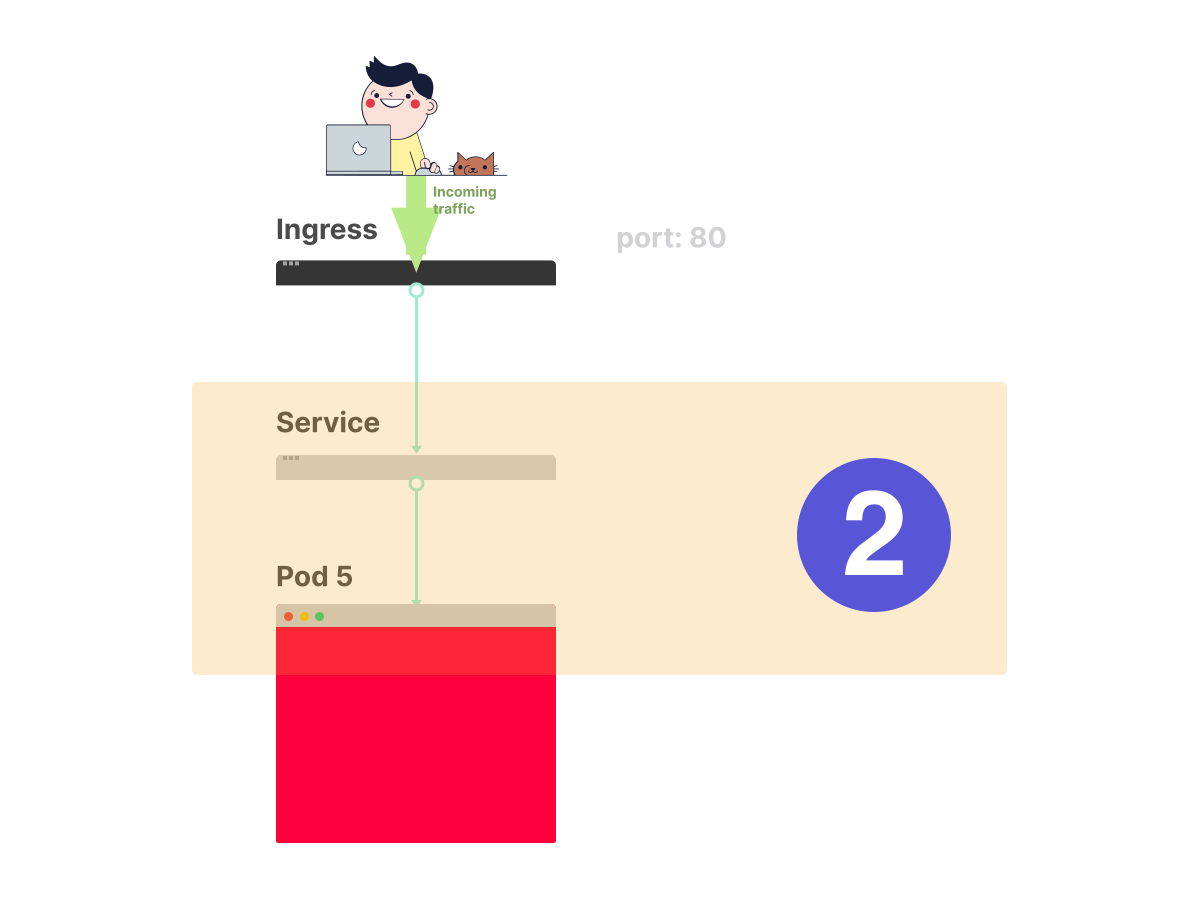
Step 2: Debug Service
Confirm Service routes traffic to healthy Pod endpoints.
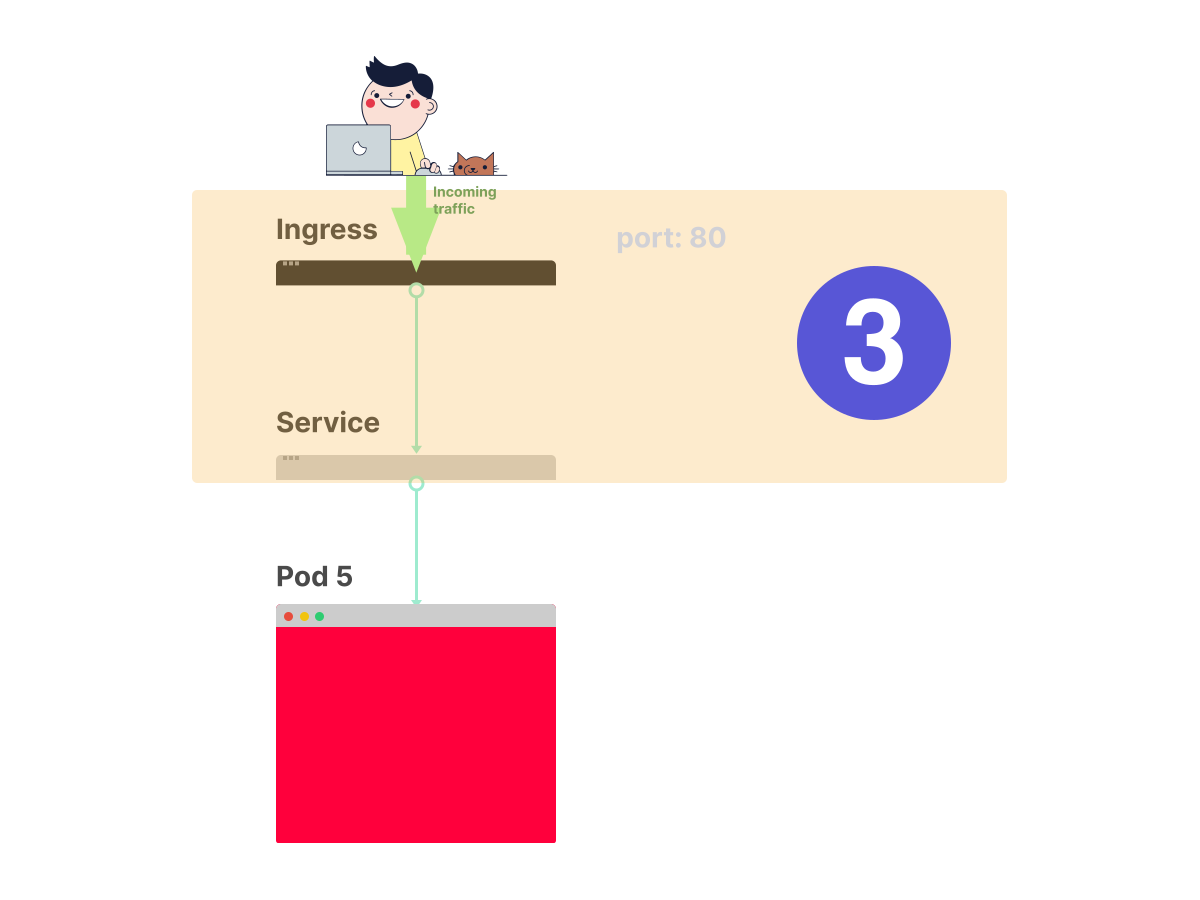
Step 3: Debug Ingress
Examine connection between Ingress controller and Service.
Most deployment failures stem from issues within the Pod itself. First check Pod status:
kubectl get pods
# NAME                    READY STATUS            RESTARTS  AGE
# app1                    0/1   ImagePullBackOff  0         47h
# app2                    0/1   Error             0         47h
# app3-76f9fcd46b-xbv4k   1/1   Running           1         47h
Four primary commands provide key insights into failing Pods:
kubectl logs <pod-name> — Retrieves stdout/stderr logs from container(s).kubectl describe pod <pod-name> — Displays lifecycle events, conditions, and resource states.kubectl get pod <pod-name> -o yaml — Extracts the active YAML definition stored in etcd.kubectl exec -ti <pod-name> -- bash — Opens an interactive shell inside a running container.ImagePullBackOffErrImagePullErrImageNeverPullImageInspectErrorRegistryUnavailableInvalidImageNameCrashLoopBackOffRunContainerErrorKillContainerErrorVerifyNonRootErrorRunInitContainerErrorCreatePodSandboxErrorOccurs when Kubernetes cannot fetch the container image. Top culprits:
imagePullSecrets are missing.Fix: Correct image name/tag, or add docker-registry secret credentials and reference in Pod spec.
The container starts, fails, and continuously restarts. Caused by application crashes, misconfiguration, or failing liveness probes.
Fix: Retrieve logs from the previous crashed container instance:
kubectl logs <pod-name> --previous
Container fails before the application inside starts executing. Caused by mounting non-existent ConfigMaps/Secrets or mounting read-only volumes as read-write.
Fix: Inspect event logs using kubectl describe pod <pod-name>.
Pod remains stuck in Pending state without being scheduled onto a node. Causes:
ResourceQuota object.Pending PersistentVolumeClaim.Fix: Inspect Events section in describe output, or view cluster-wide events:
kubectl get events --sort-by=.metadata.creationTimestamp
Pod status is Running, but 0/1 READY. Indicates that the Readiness probe is failing. The Service will NOT route traffic to this Pod.
Fix: Check readiness probe path/port and examine kubectl describe pod events.
If Pods are Running and Ready, but the application remains unreachable, inspect the Service layer.
Services route traffic to Pods via Endpoints. Verify that your Service has active target Pod IP endpoints:
kubectl describe service my-service
# Name:                     my-service
# Namespace:                default
# Selector:                 any-name=my-app
# IP:                       10.100.194.137
# Port:                     80/TCP
# TargetPort:               8080/TCP
# Endpoints:                172.17.0.5:8080, 172.17.0.6:8080
<none> or Empty?If the Endpoints field is empty, check for:
selector labels do not match Pod labels.If Endpoints lists IP addresses but connection fails, the Service targetPort is incorrect!
If Pods are Ready and Service endpoints are active, but external requests fail, debug the Ingress resource.
Check the backend linkage of your Ingress resource:
kubectl describe ingress my-ingress
# Name:             my-ingress
# Namespace:        default
# Rules:
#   Host        Path  Backends
#   ----        ----  --------
#   *           /     my-service:80 (172.17.0.5:8080, 172.17.0.6:8080)
If the Backends column displays <error: endpoints "my-service" not found>, the service.name or service.port in your Ingress definition is misconfigured.
If using NGINX Ingress Controller, install and utilize the official kubectl ingress-nginx CLI plugin for fast debugging:
# Validate NGINX configuration syntax
kubectl ingress-nginx lint --namespace kube-system

# Inspect backends configured inside NGINX
kubectl ingress-nginx backend --namespace kube-system

# Tail NGINX Ingress controller logs
kubectl ingress-nginx logs --namespace kube-system
Mastering Kubernetes troubleshooting boils down to disciplined bottom-up isolation:
Running & Ready. Resolve image pull, crash loops, or resource quota errors first.targetPort to container's containerPort. Confirm active Endpoints.service.name and service.port to your active Service and test ingress controller routing.Note: The same bottom-up diagnostic methodology applies to other Kubernetes controllers including Jobs, CronJobs, StatefulSets, and DaemonSets.
Special thanks to Gergely Risko, Daniel Weibel, and Charles Christyraj for invaluable contributions to this visual guide.